Spend $250,000 a month on leads and watch signed cases disappoint. The managing partner wants an explanation. Marketing says the leads were off — wrong case type, bad contact data, people who clicked a form and never answered their phone. Intake says marketing keeps sending low-intent prospects who were never serious about retaining. Both teams have seen enough examples to believe they're right. Neither has numbers that prove it.
The argument repeats every quarter, resolved by whoever argues loudest. Budget decisions follow instinct instead of evidence. The conversion rate stays stuck.
Three metrics — pulled from your intake CRM, segmented by lead source — resolve this in about 20 minutes. The diagnosis is almost always clear once you have them. The fix follows directly: cut the vendor, repair the intake process, or address both.
Why This Distinction Is a Budget Decision, Not Just a Process One
The answer determines where you spend money next month.
If the problem is lead quality, fix it at the source. Cut the underperforming vendor, reduce their allocation, or renegotiate terms. More intake training, additional headcount, and faster follow-up software will not help if the leads lack merit. You'll just convert bad leads faster.
If the problem is intake performance, fix it internally. Speed-to-lead, after-hours coverage, specialist coaching, scripting. Cutting a vendor with genuinely good leads because your conversion rate looks low will cost you cases you should have been signing.
These are opposite interventions. Getting the diagnosis wrong is expensive in either direction.
The Three Metrics That Separate Lead Quality From Intake Performance
Keep reading
Most PI firms track a blended conversion rate: total signed cases divided by total leads. That number is nearly useless for diagnosis. It folds lead quality signals and intake performance signals into one figure you cannot act on.
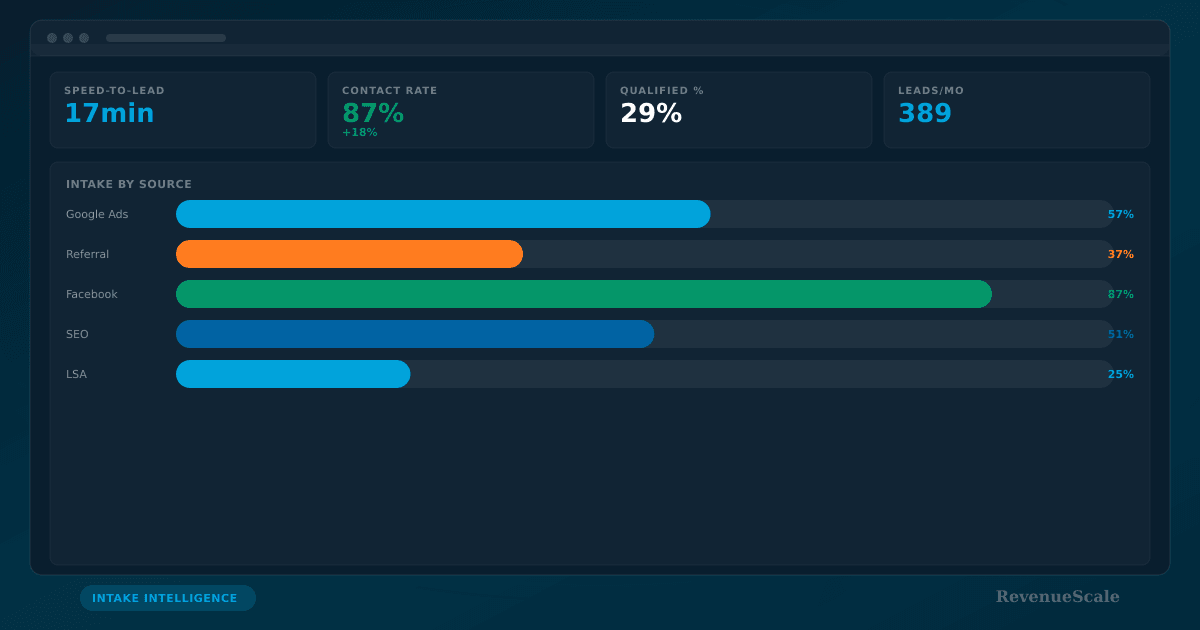
Pull the following three metrics by lead source for the past 90 days. You need source-level data, not firm-level data — that distinction is what makes the diagnosis possible.
Contact rate by source.The percentage of leads from each source that intake actually reached for a qualifying conversation — not a voicemail, not a text, but a live call. A lead intake never contacts still appears in your cost calculation. Contact rate gaps between sources often reveal quality failures at point of generation: bad phone numbers, abandoned form fills, no intent to connect. That is not an intake timing problem.
Rejection rate by source.The percentage of leads intake contacted and screened but turned down — wrong case type, wrong jurisdiction, statute of limitations, no viable injury claim. A high rejection rate on a specific vendor is a case quality signal, not an intake performance signal. Intake rejected those leads correctly; the problem is that the vendor sent them.
Net conversion rate by source. The percentage of qualifiedleads — leads intake contacted and approved — that ultimately signed retainers. This is where intake performance actually shows up. If net conversion is low across all sources, the problem is intake. If it is strong on most sources but weak on one vendor, that vendor's definition of “qualified” is the problem.
Healthy Net Conversion Rate
25–35%
Top PI intake teams convert 25–35% of qualified contacts to signed retainers. A rate below 18% across all sources points to an intake process issue, not a lead quality one.
Expected Rejection Rate Range
8–30%
Below 10% suggests intake may be signing unviable cases. Above 30% on a single source is a lead quality flag — that vendor is sending the wrong case types.
Contact Rate Variance by Source
Up to 40 pts
Contact rates vary by 30–40 percentage points across source types. Any source below 45% has a structural quality problem that faster intake response will not fix.
Running the Diagnosis: What to Pull From Your CRM
Open your intake CRM — LeadDocket, Salesforce, HubSpot, Filevine, Clio, or whatever your team logs calls in — and pull the past 90 days filtered by lead source.
For each source, record: total leads received, leads with a confirmed live contact (not a voicemail), leads rejected during screening, leads that passed screening, and leads that became signed retainers. Calculate contact rate (confirmed contacts ÷ total leads), rejection rate (rejections ÷ confirmed contacts), and net conversion rate (signed ÷ passed screening).
Only run this for sources with at least 25 leads in the window. Fewer than 25 produces rates too noisy to act on. Aggregate smaller sources by type — shared aggregators, exclusive leads, referrals, paid search — if individual vendor volume is too thin.
Representative contact rate benchmarks by source type. Your firm's rates will vary based on market, intake team structure, and response time. Use these as directional benchmarks, not exact targets.
Reading the Pattern: What the Data Is Telling You
Once you have all three metrics by source, the pattern usually points clearly in one direction.
Contact rate is uniformly low across all sources— below 50% even for referrals and Google Ads, which typically run 60–80% — and the problem is almost certainly intake coverage. After-hours gaps, slow first response, or understaffing during peak lead-arrival windows create a systemic drag that hits good leads and bad leads equally. No vendor change fixes this. Intake process does.
Contact rate is low on specific vendors only— you reach 65% of Google leads and 38% of a specific aggregator's leads with identical response times — and the problem is that vendor. Bad contact data, abandoned intent, auto-generated form fills. The intake team is not missing those calls. The leads are not real.
Rejection rate spikes on specific vendors while remaining normal on others, and those vendors are either misrepresenting their lead criteria or have drifted in the case types they generate. Intake is doing its job. The fix is a vendor conversation, not a training session.
Net conversion rate is low across all sources— after controlling for contact and rejection — and intake process is where the problem lives. Specialists are reaching and screening leads but not consistently closing retainers. This is where training, scripting, follow-up cadence, and call coaching become the right investment.
Without Source-Level Diagnostic Data
- Blended conversion rate of 8% triggers general frustration with “the leads”
- Marketing and intake argue without data to support either position
- Managing partner considers cutting the entire lead budget or replacing intake staff
- No distinction between vendors sending uncontactable leads and vendors sending bad cases
- Intake team blamed for conversion numbers driven by factors outside their control
- Budget decision made on instinct, not evidence
With Source-Level Diagnostic Data
- Contact rate report shows Vendor B at 38% vs. 63% firm average — a vendor problem, not intake
- Rejection rate report shows Vendor C sends 34% non-qualifying cases vs. 12% average
- Net conversion rate is 28% across all other sources — intake performance is not the issue
- Managing partner has specific, vendor-attributed evidence for the budget conversation
- Intake team’s strong performance on referral and Google leads is visible and credited
- Budget reallocated from Vendors B and C to sources where intake converts at 28%
What to Do With Your Findings
The diagnosis produces one of three action paths, and occasionally a combination of all three.
Vendor problem: Bring the contact rate and rejection rate data to the vendor directly. Most lead contracts include performance standards that allow credit or replacement when quality falls below agreed thresholds. If the vendor cannot or will not address the issue, reduce their allocation or cut them. Move that budget to sources where your contact and net conversion rates are healthy.
Intake problem:If net conversion rate is low across all sources, the investment belongs in intake. That might mean faster follow-up protocols, after-hours coverage, call recording reviews, revised scripting for specific case types, or additional staffing during peak volume windows. Check speed-to-lead first — response under five minutes is the single highest-impact lever available to most firms.
Both problems: Triage by impact. Cut the bad vendor first to stop the bleeding. Fix intake after that to amplify improvement across the remaining quality sources.
Either way, the decision is grounded in data your firm already has. It just needs to be sorted by source rather than blended into a single firm-level number that hides everything worth knowing.
Making This Analysis a Monthly Habit
Lead quality drifts. Vendors rotate their traffic sources and lead qualification methods. Intake team composition changes. A vendor at 65% contact rate six months ago may be at 44% today because they changed how they generate and filter leads.
Build the three-metric review — contact rate, rejection rate, and net conversion rate by source — into your monthly vendor meeting. It adds 20 minutes to a meeting that usually covers surface-level lead volume and cost-per-lead figures that cannot answer the question your managing partner is actually asking.
When intake conversion data is connected to your intake performance dashboard alongside your source-level marketing attribution, this analysis runs automatically rather than requiring manual CRM queries each month. Contact rate, rejection rate, and net conversion rate by source — updated continuously as leads move through intake.
If you want to see what that looks like for a firm managing five or more lead sources, book a demo. We'll show you how to separate lead quality from intake performance in your own data — and what the budget decisions look like once the distinction is clear.